
General
Data Sources | General
Fields & Formulas
Data Sources | Fields & Formulas
Connections
Data Sources | Connections
Creating & Sharing
Reports | Creating & Sharing
Report Editing
Reports | Editing
Report Config
Reports | Report Config
Chart Cards
Reports | Chart Cards
Content Cards
Reports | Content Cards
General
Data Chat | General
General
AI Visibility | General
General
AI | General
MCP
AI | MCP
General
Clients | General
General
Integrations | General
Webhook — Local & Reviews
Integrations | Webhook — Local & Reviews
Webhook — Automation Payloads
Integrations | Webhook — Automation Payloads
Webhook — Other
Integrations | Webhook — Other
Account & Billing
Settings | Account & Billing
Users
Settings | Users
Comments & Notes
Settings | Comments & Notes
Notifications
Settings | Notifications
FAQ
Settings | FAQ
Other
Settings | Other
General
KPI Forecasting | General
Settings & Status
KPI Forecasting | Settings & Status
Seasonality
KPI Forecasting | Seasonality
Metrics by Source
KPI Forecasting | Metrics by Source
General
Budget Tracking | General
General
Anomaly Detection | General
General
Automation Jobs | General
Change History
Automation Jobs | Change History
URL & Page Checkers
Automation Jobs | URL & Page Checkers
Local & Reviews
Automation Jobs | Local & Reviews
Search Console
Automation Jobs | Search Console
Managing Insights
Insights | Managing Insights
Change History
Insights | Change History
URL & Page
Insights | URL & Page
Local & Reviews
Insights | Local & Reviews
Other Insight Types
Insights | Other Insight Types
General
Local Listings | General
Profiles & Content
Local Listings | Profiles & Content
Performance & Activity
Local Listings | Performance & Activity
Media
Local Listings | Media
Categories & Services
Local Listings | Categories & Services
General
Reviews | General
General
Social Posts | General
Creating Posts
Social Posts | Creating Posts
Managing Posts
Social Posts | Managing Posts
Pipelines
Data Warehouse | Pipelines
Access & Credits
Data Warehouse | Access & Credits
Source Fields
Data Warehouse | Source Fields
Data Studio
Data Warehouse | Data Studio
BigQuery
Data Warehouse | BigQuery
General
Clients | General
General
Integrations | General
MCP
Integrations | MCP
Webhook — Automation Payloads
Integrations | Webhook — Automation Payloads
Webhook — Local & Reviews
Integrations | Webhook — Local & Reviews
Webhook — Other
Integrations | Webhook — Other
Account & Billing
Settings | Account & Billing
Users
Settings | Users
Comments & Notes
Settings | Comments & Notes
Notifications
Settings | Notifications
FAQ
Settings | FAQ
Other
Settings | Other
Settings | Account & Billing
Insights | Managing Insights
Integrations | General
Settings | Comments & Notes
Settings | Users
Reports | Creating & Sharing
AI | General
AI | General
AI Visibility | General
AI Visibility | General
AI Visibility | General
Integrations | Webhook — Other
Reports | Content Cards
Anomaly Detection | General
Anomaly Detection | General
Anomaly Detection | General
Insights | Other Insight Types
Anomaly Detection | General
Integrations | Webhook — Other
Anomaly Detection | General
Local Listings | General
Reviews | General
AI Visibility | General
Reports | Chart Cards
Local Listings | Profiles & Content
Data Warehouse | Pipelines
Integrations | Webhook — Automation Payloads
Integrations | Webhook — Automation Payloads
Integrations | Webhook — Automation Payloads
Integrations | Webhook — Automation Payloads
Integrations | Webhook — Local & Reviews
Integrations | Webhook — Automation Payloads
Integrations | Webhook — Local & Reviews
Integrations | Webhook — Local & Reviews
Integrations | Webhook — Local & Reviews
Integrations | Webhook — Automation Payloads
Automation Jobs | General
Automation Jobs | General
Integrations | Webhook — Automation Payloads
Integrations | Webhook — Automation Payloads
Integrations | Webhook — Automation Payloads
Automation Jobs | General
Integrations | Webhook — Automation Payloads
Integrations | Webhook — Automation Payloads
Insights | Managing Insights
Reports | Chart Cards
Reports | Creating & Sharing
Budget Tracking | General
Budget Tracking | General
Budget Tracking | General
Budget Tracking | General
Budget Tracking | General
Budget Tracking | General
Integrations | Webhook — Other
Budget Tracking | General
Budget Tracking | General
Local Listings | General
Local Listings | Media
Social Posts | General
Settings | Account & Billing
Reports | Editing
Reports | Creating & Sharing
Local Listings | Categories & Services
Local Listings | Categories & Services
Local Listings | Categories & Services
Settings | Users
AI Visibility | General
Settings | Other
Clients | General
Clients | General
Clients | General
Reports | Chart Cards
Settings | Notifications
AI Visibility | General
Data Sources | General
Integrations | General
Integrations | General
AI | MCP
Data Sources | Connections
Data Sources | Connections
Data Sources | Connections
Data Sources | Connections
Data Sources | Connections
Data Sources | Connections
Data Sources | Connections
Data Sources | Connections
Data Sources | Connections
Local Listings | Media
Data Warehouse | Data Studio
Data Warehouse | Data Studio
Data Warehouse | Data Studio
KPI Forecasting | General
Reports | Creating & Sharing
Reports | Report Config
Reports | Creating & Sharing
Clients | General
Data Warehouse | Data Studio
KPI Forecasting | General
Data Warehouse | Pipelines
Data Warehouse | BigQuery
Social Posts | Creating Posts
Automation Jobs | General
Social Posts | Creating Posts
Anomaly Detection | General
Automation Jobs | General
Reports | Editing
Data Chat | General
Data Sources | General
Data Sources | General
Data Sources | General
Data Warehouse | Data Studio
Data Warehouse | Access & Credits
Data Warehouse | Access & Credits
Data Warehouse | Access & Credits
Clients | General
Settings | Users
Settings | Comments & Notes
Data Sources | General
Reports | Chart Cards
Social Posts | Managing Posts
Social Posts | Creating Posts
Data Warehouse | Data Studio
Settings | Notifications
Data Warehouse | Pipelines
Settings | Comments & Notes
Settings | Notifications
Settings | Notifications
Reports | Creating & Sharing
Reports | Creating & Sharing
Social Posts | Managing Posts
Data Warehouse | Pipelines
KPI Forecasting | Metrics by Source
Automation Jobs | URL & Page Checkers
Insights | URL & Page
Data Warehouse | Source Fields
KPI Forecasting | Metrics by Source
Reviews | General
Reports | Report Config
Reports | Report Config
Data Sources | General
Data Sources | Fields & Formulas
Data Warehouse | Source Fields
Settings | FAQ
Settings | FAQ
Data Sources | Connections
Data Sources | Connections
Automation Jobs | Change History
Insights | Change History
KPI Forecasting | Metrics by Source
Automation Jobs | URL & Page Checkers
Insights | URL & Page
Automation Jobs | Change History
Insights | Change History
KPI Forecasting | Metrics by Source
Data Warehouse | BigQuery
Automation Jobs | Change History
Insights | Change History
KPI Forecasting | Metrics by Source
Data Warehouse | Source Fields
Automation Jobs | Local & Reviews
Insights | Local & Reviews
Automation Jobs | Local & Reviews
Insights | Local & Reviews
Automation Jobs | Local & Reviews
Insights | Local & Reviews
Data Warehouse | Source Fields
Data Sources | Connections
Data Sources | Connections
Automation Jobs | Change History
Insights | Change History
Automation Jobs | Local & Reviews
Insights | Local & Reviews
Data Warehouse | Source Fields
Data Warehouse | Source Fields
Budget Tracking | General
KPI Forecasting | Settings & Status
Data Warehouse | Data Studio
Data Chat | General
Settings | Comments & Notes
Local Listings | Profiles & Content
AI Visibility | General
Settings | Other
Settings | FAQ
Reports | Content Cards
Reports | Content Cards
Local Listings | Media
Insights | Managing Insights
Insights | Managing Insights
Integrations | General
AI | MCP
KPI Forecasting | Settings & Status
KPI Forecasting | Settings & Status
KPI Forecasting | General
Integrations | Webhook — Other
KPI Forecasting | Settings & Status
Insights | Other Insight Types
KPI Forecasting | General
KPI Forecasting | Seasonality
KPI Forecasting | Settings & Status
KPI Forecasting | Seasonality
Reports | Chart Cards
Local Listings | Performance & Activity
Local Listings | Performance & Activity
Local Listings | Profiles & Content
Local Listings | Media
Integrations | General
Data Warehouse | BigQuery
Data Warehouse | BigQuery
Data Warehouse | Data Studio
Settings | Other
Data Chat | General
Local Listings | Media
Local Listings | Media
Local Listings | Media
Social Posts | General
Local Listings | Media
Local Listings | Media
Data Chat | General
KPI Forecasting | Metrics by Source
Automation Jobs | URL & Page Checkers
Insights | URL & Page
Reports | Chart Cards
AI | MCP
Local Listings | Profiles & Content
Automation Jobs | URL & Page Checkers
Insights | URL & Page
Reports | Report Config
Reviews | General
Data Warehouse | Pipelines
Local Listings | General
Clients | General
Social Posts | Creating Posts
Reports | Creating & Sharing
AI Visibility | General
Social Posts | Managing Posts
Local Listings | Profiles & Content
Data Warehouse | Data Studio
Reports | Report Config
Insights | Managing Insights
Reviews | General
Reports | Editing
Reports | Creating & Sharing
Reports | Report Config
Insights | Managing Insights
Reviews | General
Reviews | General
Reviews | General
Automation Jobs | URL & Page Checkers
Insights | URL & Page
Automation Jobs | URL & Page Checkers
KPI Forecasting | Settings & Status
Clients | General
Reports | Chart Cards
Social Posts | Managing Posts
Automation Jobs | Search Console
Insights | Other Insight Types
Automation Jobs | Search Console
Insights | Other Insight Types
Local Listings | General
Clients | General
Reports | Creating & Sharing
Integrations | General
Local Listings | Categories & Services
Local Listings | Categories & Services
Settings | Account & Billing
Reports | Creating & Sharing
AI Visibility | General
Social Posts | General
AI Visibility | General
Settings | FAQ
Settings | Account & Billing
Reports | Content Cards
Data Sources | Fields & Formulas
Reports | Report Config
Reports | Content Cards
Settings | Account & Billing
Data Sources | Fields & Formulas
Reviews | General
Settings | Account & Billing
Clients | General
Data Warehouse | Data Studio
Settings | Users
Settings | Users
Social Posts | General
Settings | Other
Local Listings | Performance & Activity
Settings | Comments & Notes
Integrations | Webhook — Other
Settings | FAQ
Display metrics over time with a line chart. Visualize trends across one or multiple data series with customizable axes, styling, and color options.
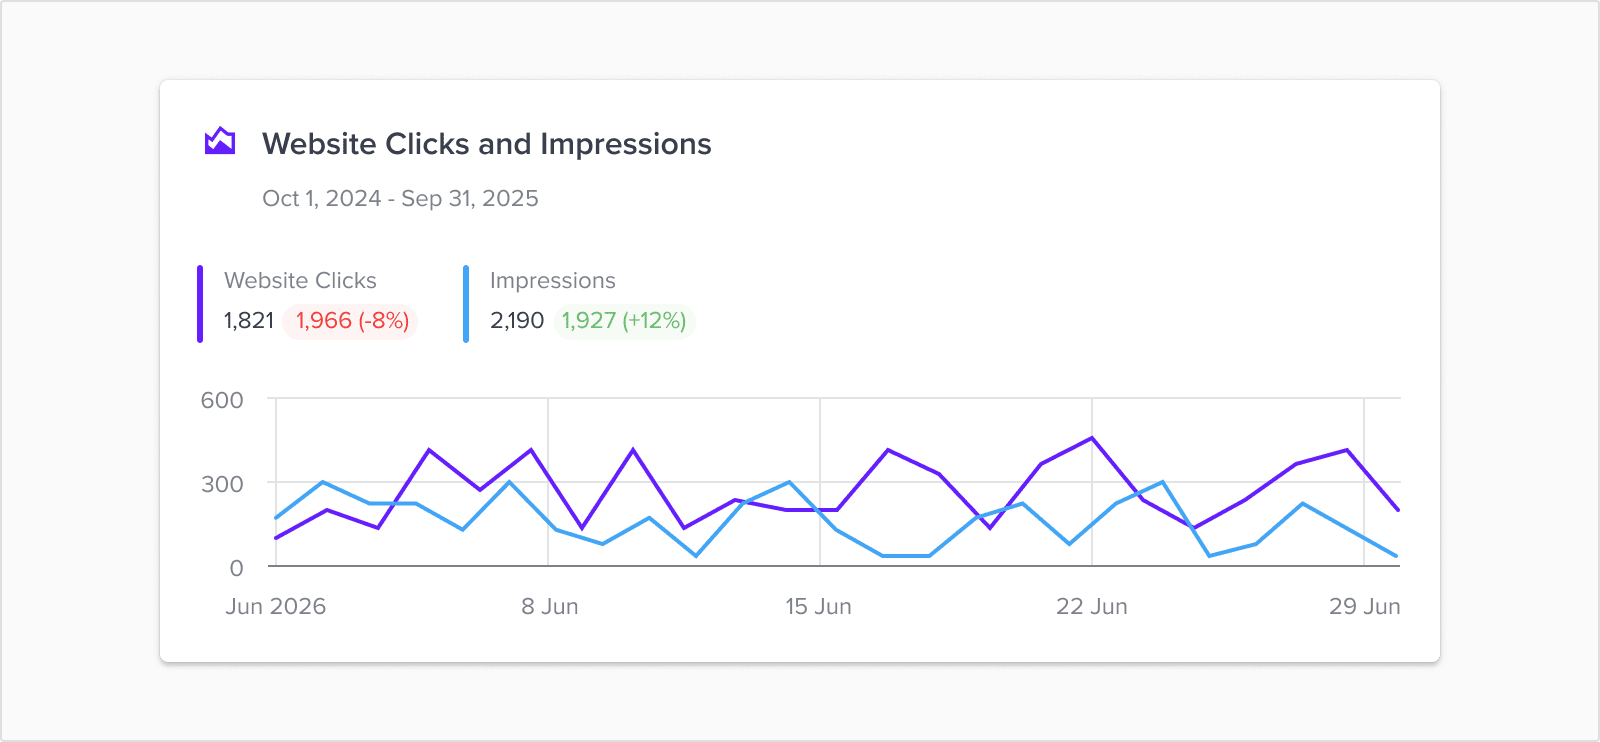
A line chart connects data points with lines, making it ideal for showing changes and trends over time. Use it to compare multiple metrics across channels, campaigns, or time periods, or to track a single metric's trajectory across the report's date range.
Reach for a different chart when the story isn't about time: use Donut for part-to-whole, Bar or Column for ranking categories, and Scatter for correlation between two metrics.
Open AI Edit and describe what you want in plain language. See AI Edit a Card for the full flow - a couple of line-chart-specific things are worth knowing:
Select your time period, choose dimensions and metrics to visualize, and set sorting and comparison options. Metrics and dimensions come from connected sources and custom fields in the Data Model.
A line chart's Data tab always uses a time dimension plus granularity (Day, Week, Month, Quarter, Year); an optional single split-by dimension breaks one metric into multiple series (for example spend by campaign, instead of one spend total). When Comparison is on, choose Previous period, Previous year, or - for multi-location clients - All-location average to benchmark against the average across locations.
Full mechanics of metrics, dimensions, filters, date range, and comparison are shared across every chart and table type - see Data Query.
Customize the visual appearance and behavior of your line chart. Options are grouped into per-metric series settings, common display options, and the two axes.
Each metric on the chart has its own settings, so you can mix chart styles within one card - for example spend as a column with clicks as a smooth line.
| Setting | Options |
|---|---|
| Type | Line, Smooth line, Area, Area Spline, or Column - rendered per metric, independent of the card's overall "Line Chart" type. |
| Line Style | Solid, Dash, Dot, DashDot, LongDash, ShortDot. |
| Line Width | 1-6px. |
| Opposite side of chart | Puts this metric on a secondary Y axis - use when one metric's scale would flatten the others. |
| Show markers / Marker size | Off by default; Small, Medium, Large, or XL when enabled. |
| Setting | What it controls |
|---|---|
| Animation | Enable/disable the draw-in animation when the card loads. |
| Tooltip | On hover, shows all series values for that point together. When comparison is enabled, each value includes a ↑ / ↓ / → indicator against the comparison period. |
| Legend + Position | Show/hide the legend; position it Top, Bottom, Left, or Right. |
Title, Reversed, Grid lines, and Labels. The X axis defaults to a datetime scale (matching the time dimension) rather than categories.
Title, Min, Max, Reversed, Grid lines, and Labels. Set Min/Max manually to lock the scale - useful when comparing two line charts side by side and you want matching axes.
The Chart tab: per-metric series options, common options, and axis settings.
Line charts have no stacking option - each series is drawn independently. If you want stacked values, use Area or Column, both of which support None/Normal/Percent stacking.
Configure how your chart is displayed and styled within your report. Customize title, description, icon, and styling (background, border, shadow, padding, alignment) for light and dark modes independently. Reset to your report's default theme at any time.
%402x.png)
Control the color scheme used in your chart. Turn on Use Report Theme Palette to follow the theme, or pick a different palette for this card. Light and dark mode colors are configured separately, and any per-series color you set on the Chart or Custom tab takes precedence over the palette.
Full details: Palettes. Default palette on a theme: Create Theme.
%402x.png)
Enable advanced customization using raw JSON. Unlike the Chart tab's fixed set of controls, the Custom tab merges directly into the chart's underlying Highcharts configuration, so any valid Highcharts option is fair game - not just the ones exposed in the UI. See Custom Visualizations for merge order, limits, and examples.
Common patterns:
series[0].color (hex only, e.g. "#4F46E5")colors array of hex stringsplotOptions.series.* (e.g. plotOptions.series.dashStyle) over one-off per-series propertiesxAxis.labels.style, yAxis.title.textInvalid JSON blocks the save, so use a JSON validator if you're pasting a large snippet. This tab is meant for edge cases the Chart tab doesn't cover - for everyday styling, the Chart tab is safer since it won't be overwritten by a chart-type change.
| Problem | Likely cause | What to try |
|---|---|---|
| X axis shows categories instead of dates | No time dimension set, or granularity missing | Confirm a time dimension and granularity are set on the Data tab |
| One line looks flat compared to the others | Metrics on very different scales, all on the primary axis | Move the smaller-scale metric to the opposite (secondary) axis on the Chart tab |
| Too many lines to read | A split-by dimension with high cardinality (e.g. campaign name) | Filter to top N, or switch to a Table for the full breakdown |
| Tooltip has no ↑/↓ indicator | Comparison is off, or the chart type doesn't have a prior-period result | Enable Comparison on the Data tab and choose a period |
| Chart-type toggle reset my styling | Changing chart type resets the card's visualization settings | Re-apply Chart tab styling after switching chart types; set it last |
| Custom tab JSON won't save | Invalid JSON syntax | Validate the JSON structure before pasting; check for trailing commas |
Thanks a lot for your feedback! If you’d like a member of our support team to respond to you, please send a message here
Oops! Something went wrong while submitting the form.
Thanks a lot for your feedback! If you’d like a member of our support team to respond to you, please send a message here
Oops! Something went wrong while submitting the form.