Analytics
Dale McGeorge
Head of Product


We asked 11 AI models nine everyday marketing questions, like "how many leads did we get?", on one real business's GA4, Google Ads and Search Console data. None has one right answer, so we recorded which metric each model chose and why. They agreed when one metric fit, split when the question needed a business decision, and often contradicted themselves.
The data
What every model could query
Five tables from Homer's Donuts' GA4, Google Ads and Search Console accounts, the same for all 11 models.
GA47 metrics · 7 dimensions
Metrics
Dimensions
Tables
Google Ads5 metrics · 7 dimensions
Metrics
Dimensions
Tables
Search Console4 metrics · 5 dimensions
Metrics
Dimensions
Tables
Not in the data: a lead or form-submission metric, an order count, or which events GA4 counts as key events. Every definition in this post was the model's own choice.
In The AI verification problem we scored 11 AI models on 16 questions that have one right answer. Some of the everyday questions you'd actually ask an AI aren't like that. "How many leads did we get?" depends on what you call a lead, and no table in GA4 or Google Ads says.
So for these questions we didn't ask whether the models were right. We asked what they chose: which data set they reached for, which metric they led with, what they reported alongside it, and how they explained the choice. Across 98 answers, that gives a fair picture of how an AI analyst thinks about marketing data when nobody has told it your definitions.
The setup is the same as the first post. The business is Homer's Donuts, a donut shop in Springfield that sells online, runs five Google Ads campaigns and tracks its site with GA4 and Search Console. The name is ours; every number is real data from a real business's account for September 2026.
Each of the 11 models worked as an agent with the schema in its prompt, a run_sql tool and the tidy tables a connector produces: GA4 by day and by month, Google Ads campaigns by day, and Search Console by day. Each question was asked once per model, with no instructions about definitions.
Each chart below shows one question. The left column is the figure the model led with, the middle shows what else it reported, and the platform icon tells you which data set each figure came from. Under each row is the model's own reason, quoted from its answer. Use the Answer button to read the full reply and the SQL behind it. The bars at the bottom show how many of the 11 models led with each metric, and how many reported it alongside.
Asked for September's sales, all 11 models led with GA4 revenue, $13,676. Most added the 71 key events as a count of orders, and two noted Google Ads' own conversion value of $5,686 as a different number.
Same data, same question
“What were our sales in September?”
Loading the chart…
Conversion rate was nearly as uniform: 10 of 11 divided GA4 key events by sessions and reported 3.4%. Five also gave a rate per user, 4.5%, and DeepSeek worked one out per summed daily user, 3.5%. Gemini 3.8 Flash gave both without choosing.
Same data, same question
“What's our website conversion rate for September?”
Loading the chart…
What these have in common is that the data offers one obvious candidate. GA4 has a revenue column and nothing else that looks like sales. When that's true, the models behave the same way, and they mostly tell you what they used.
Leads is where they start to diverge. Six models counted every GA4 key event, 71. GLM used Google Ads conversions, 80. Gemini 3.8 Flash counted only key events with no revenue attached, 27, on the reasoning that a purchase isn't a lead. Claude Sonnet 5.5 and Qwen said the data has no lead metric, and Gemini 3.1 Pro listed six candidate figures without choosing one.
Same data, same question
“How many leads did we get in September?”
Loading the chart…
The interesting answers are the ones that split the counts. Gemini 3.1 Pro, Gemini 3.8 Flash, Grok, Qwen and DeepSeek all separated conversions or key events by whether they carried revenue, treating the ones without revenue as leads and the rest as sales. Qwen went furthest, counting visits to the contact and quote pages. None of these is wrong. They're different businesses' definitions, and the model had to guess which one is yours.
The next question asked for cost per lead from Google Ads. All 11 models gave the same answer: $2,481 of spend over 80 Google Ads conversions, $31.01.
Same data, same question
“What's our cost per lead from Google Ads in September?”
Loading the chart…
That agreement hides a problem. Seven of the eight models that gave a lead count in the previous question used GA4: six said 71 leads and Gemini 3.8 Flash said 27. Every one of them then priced leads using Google Ads' 80 conversions. Only GLM used the same definition both times.
Put those two answers in one monthly report and they don't reconcile: 71 leads at $31.01 each comes to $2,202, not the $2,481 you spent. Three models, Claude Opus 5.5, Kimi and Qwen, did report the GA4 view alongside: Google Ads spend over the 18 key events from paid search is $138 a lead, more than four times the headline.
"How much revenue did our marketing drive?" produced five different headline figures, one breakdown by channel, and three models that wouldn't pick one.
Same data, same question
“How much revenue did our marketing drive in September?”
Loading the chart…
The split is about which traffic counts as marketing. Three models took everything except direct traffic, $9,882. Two counted paid and organic search, $7,547. Qwen added visits from AI assistants, $7,756. Claude Haiku 5.5 counted paid search only, $3,200. No model led with all of GA4's revenue, $13,676, though most reported it alongside. Every one of these boundaries is defensible, and the largest answer is three times the smallest.
Google Ads says its campaigns returned $2.29 for every dollar. GA4 credits paid search with $3,200 of revenue on $2,481 of spend, a return of 1.29. Both say yes, but by very different margins, and the models split on which to believe.
Same data, same question
“Did Google Ads pay for itself in September?”
Loading the chart…
Three led with GA4's 1.29, two with Google Ads' 2.29, Gemini 3.8 Flash with the profit on Google Ads' figures, and four reported both without choosing. Kimi didn't return an answer. Claude Opus 5.5 summed up the case for GA4: "Google Ads is probably counting more than purchases, and it also gives itself credit by its own rules." GLM made the case the other way: since the question is about a paid channel, lead with the platform's figure.
This is the question where the choice of data set changes the decision.
Same data, same question
“If we had to cut one Google Ads campaign, which one should it be?”
Loading the chart…
Eight models judged the campaigns on Google Ads ROAS and named Glazed Donuts, which returned the least conversion value per dollar. Three judged them on GA4 revenue per campaign and named Brand, because GA4 credits Brand with far less revenue than Google Ads does. Qwen put it plainly: Google Ads' claim for Brand is "~8x larger than any other campaign's, so its reported return is not credible." Same data, opposite budget actions, and the deciding factor was which platform the model trusted.
Asked which channel performed best, 10 of 11 judged on GA4 revenue, and 9 named organic search. Claude Sonnet 5.5 named Direct, and Claude Haiku 5.5 judged on return on ad spend and named paid search, pointing out that Direct "has no media cost, so it isn't comparable on efficiency."
Same data, same question
“Which channel performed best in September?”
Loading the chart…
Asked how September went compared with August, the models agreed on what belongs in a summary and disagreed on what to lead with. Five opened with sessions, two with users, two with revenue, and Claude Haiku 5.5 with Google Ads spend. This was the only question where every model used Search Console. Ten took users from GA4's monthly table, 1,576. DeepSeek added up daily users instead and reported 2,016, the same mistake that sank the users-by-channel question in the first post.
Same data, same question
“How did September go compared to August?”
Loading the chart…
Put the nine questions side by side and a few habits show up.
All nine questions
Which data set each model reached for first
Loading the chart…
Hedging isn't a flaw here. A model that says "this depends on what you count as a lead" is giving you a more honest answer than one that picks 71 without saying why. But it still leaves the decision with you.
None of these answers is wrong, and that's the point. Each is a reasonable reading of a question that needs a business decision, and each model made that decision for you, differently, often without saying so. Ask the same model two related questions and it may decide differently each time.
The fix isn't a smarter model. It's deciding these things once:
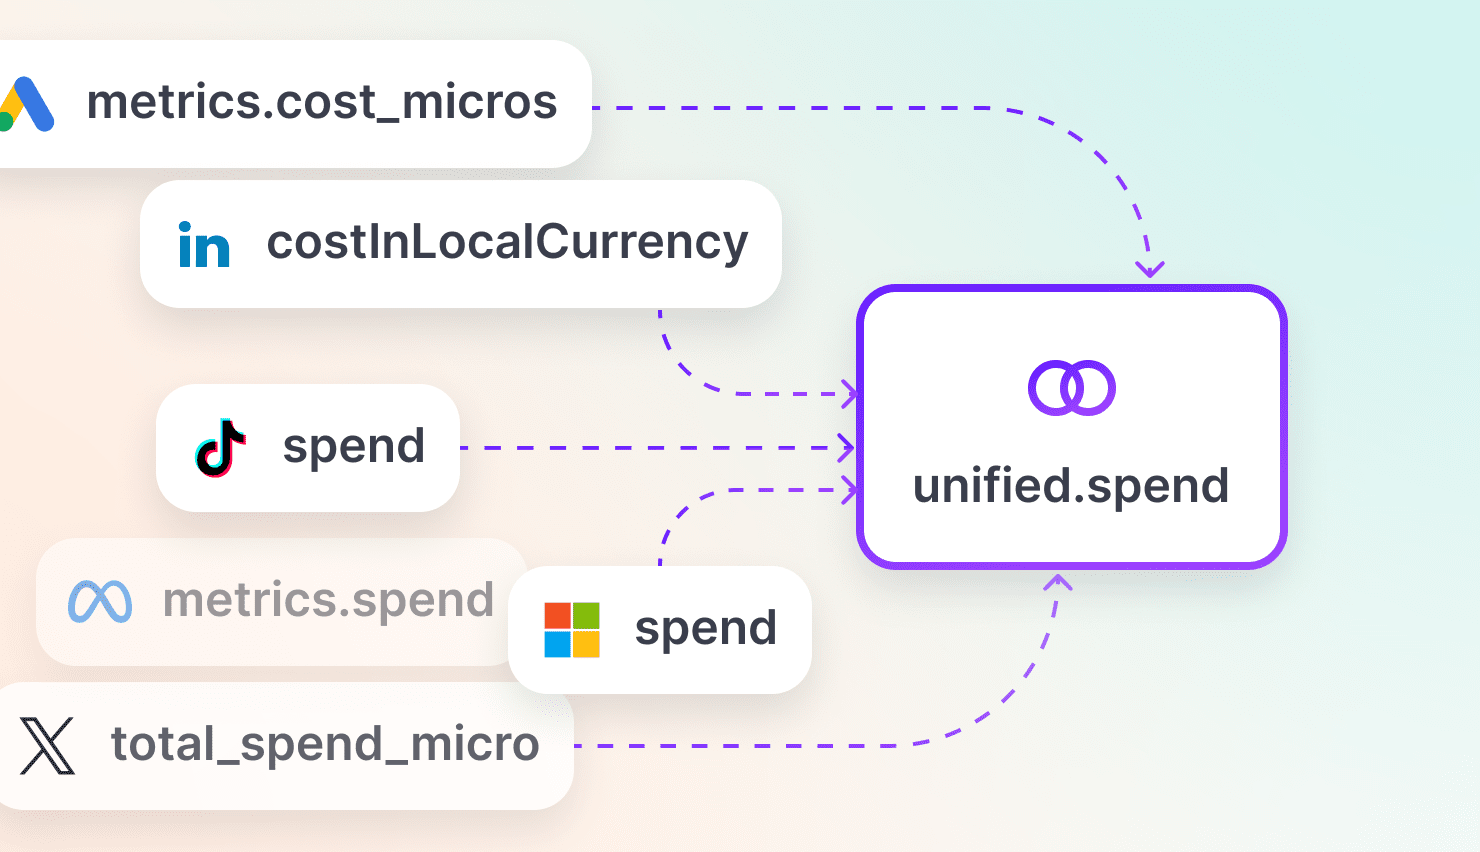
Then make every answer use them. That's what a data model is for: in The AI verification problem we showed how it keeps answers right when the rules are known. It does the same for definitions, once you've made them.
One business, one month and one run per model, so treat the splits as illustrations of how models choose, not fixed traits of each model. The models, versions and settings are the same as in the first post, all at their API's default reasoning effort, writing SQL against connector-style tables in DuckDB.
To compare the answers, Claude Sonnet 5.5 read each model's SQL and reply and matched its figures to a fixed list of metrics per question, choosing the one it led with and the others it reported. Every quote is copied word for word from the model's answer, and you can check each one with the Answer button. Campaign names, page paths and search terms have been relabelled to fit the name; the figures and the logic of every query are unchanged.
Thanks a lot for your feedback! If you’d like a member of our support team to respond to you, please send a message here
Oops! Something went wrong while submitting the form.