
Marketing
Dale McGeorge
Head of Product


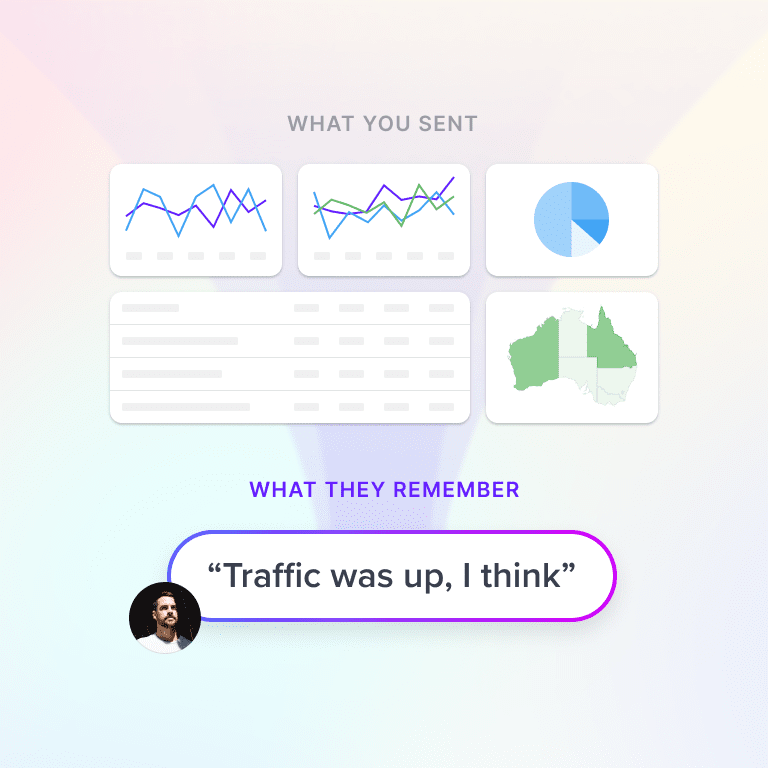
Clients rarely churn because the results were bad. They churn because the value was illegible — and the report is the artefact carrying it. Your renewal gets decided in a budget meeting you don't attend, by someone who has never opened your dashboard.
Somewhere in the next quarter, a budget review will happen that you are not invited to.
Your day-to-day contact will be in the room. So will someone more senior who has never opened Google Ads, has a spreadsheet of line items in front of them, and is looking for the two or three that can be cut without anyone noticing.
Your contact will have to defend your line item. They’ll do it from memory, under time pressure, using whatever they retained from the last few months of your reporting. If they can’t make the case in about ninety seconds, your retainer moves into the “review” column.
That meeting is where churn actually gets decided. Not in the renewal call, which is usually just the announcement.
AgencyAnalytics surveys agency leaders annually; their 2025 benchmarks report drew on 220-plus of them. When asked what drives client retention, the ranking came out like this.
AgencyAnalytics 2025 Benchmarks · n=220+ agency leaders
Agency leaders rank performance third
Asked what drives retention, practitioners put two forms of comprehension above the work itself.
The two factors above performance are both about whether the client understands and believes what is happening. The report is the artefact carrying both.
Sit with that ordering, because it’s counterintuitive coming from practitioners. Agency leaders — people whose job is delivering performance — put performance third. The two factors above it are both, fundamentally, about whether the client understands and believes what is happening.
A note on the numbers in this post
If you search for agency churn statistics you will find a great many extremely confident, extremely specific figures. “73% of clients who leave cite poor communication.” “Clients receiving narrative reports churn at 9% versus 31%.” We chased several of these and could not trace them to any identifiable study, survey or sample. They appear to circulate between content marketing posts, acquiring authority through repetition.
We’ve left them out. What’s cited below is either a named study you can go and read, or clearly flagged as directional. Where a well-known statistic has a shakier provenance than its popularity suggests, we say so.
Here is the structural problem, and it applies even when your work is excellent. Your work is continuous. Your client’s perception of your work is sampled.
You optimise on a Tuesday. You catch a tracking break on a Thursday. You rewrite ad copy over a weekend. None of that registers with the client at the moment it happens. Their sense of your value updates only when you report — and between reports, it decays. Not because they’re ungrateful, but because they have their own job, and the last thing they heard from you was three weeks ago.
Conceptual model
Work accumulates. Belief decays.
Each report lifts perceived value, then it falls away. Thin or infrequent reports produce small lifts, the decay wins, and the gap compounds quietly.
Illustrates a mechanism, not measured data. You are not paid for the work — you are paid for the transmitted, retained belief that the work happened and mattered.
Which is why the most dangerous churn is the kind that happens to accounts that are performing well.
Every client report has two audiences. Most agencies write for one of them.
Reader one is your day-to-day contact. They know the context. They were on the kickoff call. They speak enough platform language to know roughly what a CTR is. They like you. They forgive ambiguity, fill in gaps from memory, and give you the benefit of the doubt.
Reader two is whoever your contact answers to. A CFO, a founder, a VP of Marketing. They have never opened your dashboard. They’ll see your report for ninety seconds, out of context, probably as a forwarded PDF or a screenshot dropped into a slide — and they are comparing your line item against every other line item.
Reader two does not forgive ambiguity, because reader two is not evaluating you. They’re evaluating an expense.
The hop you don’t see
Almost everything is lost at the second handover
You optimise the first hop. You get judged on the second one.
The test: could your contact defend your invoice using only your report, to someone who doesn’t know what a session is?
There’s a corollary worth naming, because it explains a lot of churn that otherwise looks random. When your champion leaves the company, your retainer is defended entirely by the artefact. The relationship equity is gone overnight. Whatever your reports established on their own is all you have — and agencies with thin reporting routinely lose healthy, well-performing accounts within two months of a contact changing jobs, then attribute it to bad luck.
You report in platform nouns. They budget in business nouns. Every untranslated metric is a small piece of work handed to the reader — and readers don’t do that work, they just discount the number.
The currency exchange
What you reported, and what they needed to hear
Same underlying performance. One version survives a budget meeting; the other does not.
| What you reported | What reader two hears | What they needed |
|---|---|---|
| 1.4M impressions, up 22% | A big number I can’t price. | Reach cost £0.004 per person; the audience saw us 3× more often for the same spend. |
| CTR improved 0.4pp | Nothing. Genuinely nothing. | The same budget now brings 1,100 more visits a month. |
| 42,000 sessions | Is that good? | Up 18% MoM, 31% YoY, against a 38,000 target. |
| ROAS 4.2× | Is that before or after my costs? | £4.20 revenue per £1 of media; roughly £2.60 after COGS. |
| 320 conversions | Conversions to what? | 320 quote requests → 96 sales calls → 24 new customers. |
| Average position 3.2 | We were 4th, now 3rd? | Non-brand organic now delivers 19% of pipeline, up from 11%. |
This is not a presentation problem. It is a survival problem — impressions are not ammunition in a CFO conversation.
The Duke Fuqua CMO Survey (Spring 2025) found 63% of CMOs reporting increased pressure from their CFO to prove ROI, and 61% from their CEO. Your report is either ammunition in that conversation or a liability in it.
“4,200 sessions” is not information. It’s a fact with nothing to compare it to, and a fact that can’t be judged gets ignored. Information is: 4,200 sessions, up 18% on last month, up 31% year on year, against a target of 4,000.
Every headline number needs at least one comparison — prior period, prior year, or target. Ideally all three. This is cheap, and most reports still don’t do it.
Charts show what. Clients are paying for why and so what. The chart is evidence; the sentence is the product. And the sentence is exactly what gets dropped when reporting day collides with a pitch deadline — which means the one component reader two can actually consume is the one most likely to be missing.
A useful discipline: every report should answer three questions in plain sentences before any chart appears. What changed? Why? What are we doing about it?
A monthly PDF is a twelve-frames-per-year film of a continuous business. Meanwhile your client heard about a bad week from their sales team on day four and has been quietly worrying ever since.
Silence between reports doesn’t stay empty. It gets filled with the client’s own inference, and the client’s own inference is rarely generous.
You redesigned the report. You swapped a metric. A definition drifted underneath you — which, as we’ve written about at length, happens constantly and silently in marketing data.
Now month-over-month comparison is impossible, and here’s the expensive part: when a client finds one number they can’t reconcile, their confidence drops in all your numbers, not just that one. Consistency isn’t an aesthetic preference. It’s a credibility mechanism.
The commonly quoted figure is that a business hears from only about 4% of its dissatisfied customers. It’s usually credited to TARP research from the 1990s, sometimes to Ruby Newell-Legner’s Understanding Customers. Honestly, the chain of custody on that specific number is weak, and we’d treat it as a well-worn illustration rather than hard evidence.
The mechanism, though, doesn’t need the statistic. Think about what it would actually take for a client to complain about your report. They’d have to admit, in writing, to a vendor they’re paying, that they don’t understand something they’ve been receiving for eight months and nodding along to. It’s socially expensive and offers them almost nothing in return. The rational move is to stop opening it, and eventually to stop renewing.
Silent churn
Silence reads the same either way
Whether your report is excellent or unopened, your inbox looks identical. That is what makes it useless as a signal.
Ratio is illustrative — see the note on sources. The mechanism holds regardless of the exact number.
This is the practical argument for delivering reports as live links rather than only as PDF attachments. A PDF tells you nothing after it leaves your outbox. A live link tells you whether it was opened, when, for how long, and which sections held attention.
A client who stopped opening your reports three months ago is not a satisfied client. They’re a quiet one — and that’s the closest thing to an early warning system this business offers. It’s also, usefully, actionable while there’s still time.
Published churn benchmarks for agencies are messy and mostly vendor-sourced, so treat precise figures sceptically. The shape, though, is consistent across everything we found: project-based work churns hardest and retainers least; smaller agencies churn more than larger ones; and the dangerous window arrives once onboarding novelty wears off and the reporting rhythm is the entire relationship — commonly somewhere around months four to six.
That window is not a communication problem you can fix with a quarterly business review. By the time the QBR is scheduled, the impression has already set. So audit what you’re actually sending.
We make reporting software, so weigh this accordingly. It’s here because everything above dictated how we built it.
The analysis is written, not just charted. The AI Analyst drafts the narrative from the client’s actual goals, industry, budgets and history — not a generic template. That distinction matters more than it sounds: a narrative that doesn’t know the business produces exactly the bland filler that erodes trust faster than no narrative at all.
Every channel in one report. GA4, Google Ads, Meta, Search Console, LinkedIn, Microsoft, TikTok and the rest. A client assembling four separate PDFs is doing your synthesis for you, and resenting it.
Master Reports hold structure steady across periods and across clients, so month three is comparable to month twelve. That’s the credibility mechanism from section five, enforced by default.
Live links alongside PDF exports, so engagement is something you observe rather than something you assume.
White-labelled on your domain, your branding, your sending address — because for most retainers the report is the product surface.
None of which writes your strategy. What it removes is the excuse for skipping the narrative on a busy month.
Return to the budget review you weren’t invited to.
Everything you did that quarter — the optimisations, the fixes, the judgment calls nobody saw — arrives in that room compressed into whatever one person can recall under pressure. That’s the actual delivery mechanism for your value, and it’s far narrower than the forty-page PDF you spent Tuesday building.
Your best work is not self-evident. Somebody has to be able to repeat it, badly, from memory, to a sceptic, and still be convincing.
You’re not reporting on the work. You’re arming the person who has to defend it.
Thanks a lot for your feedback! If you’d like a member of our support team to respond to you, please send a message here
Oops! Something went wrong while submitting the form.


